 Nordic Gradient
The problem
A modern object detector can be trained in a few lines of code. That makes it easy to use one without knowing why it misses what it misses. To understand what happens inside, I built a detector from scratch in PyTorch and measured it against an established one, trained on the same data.
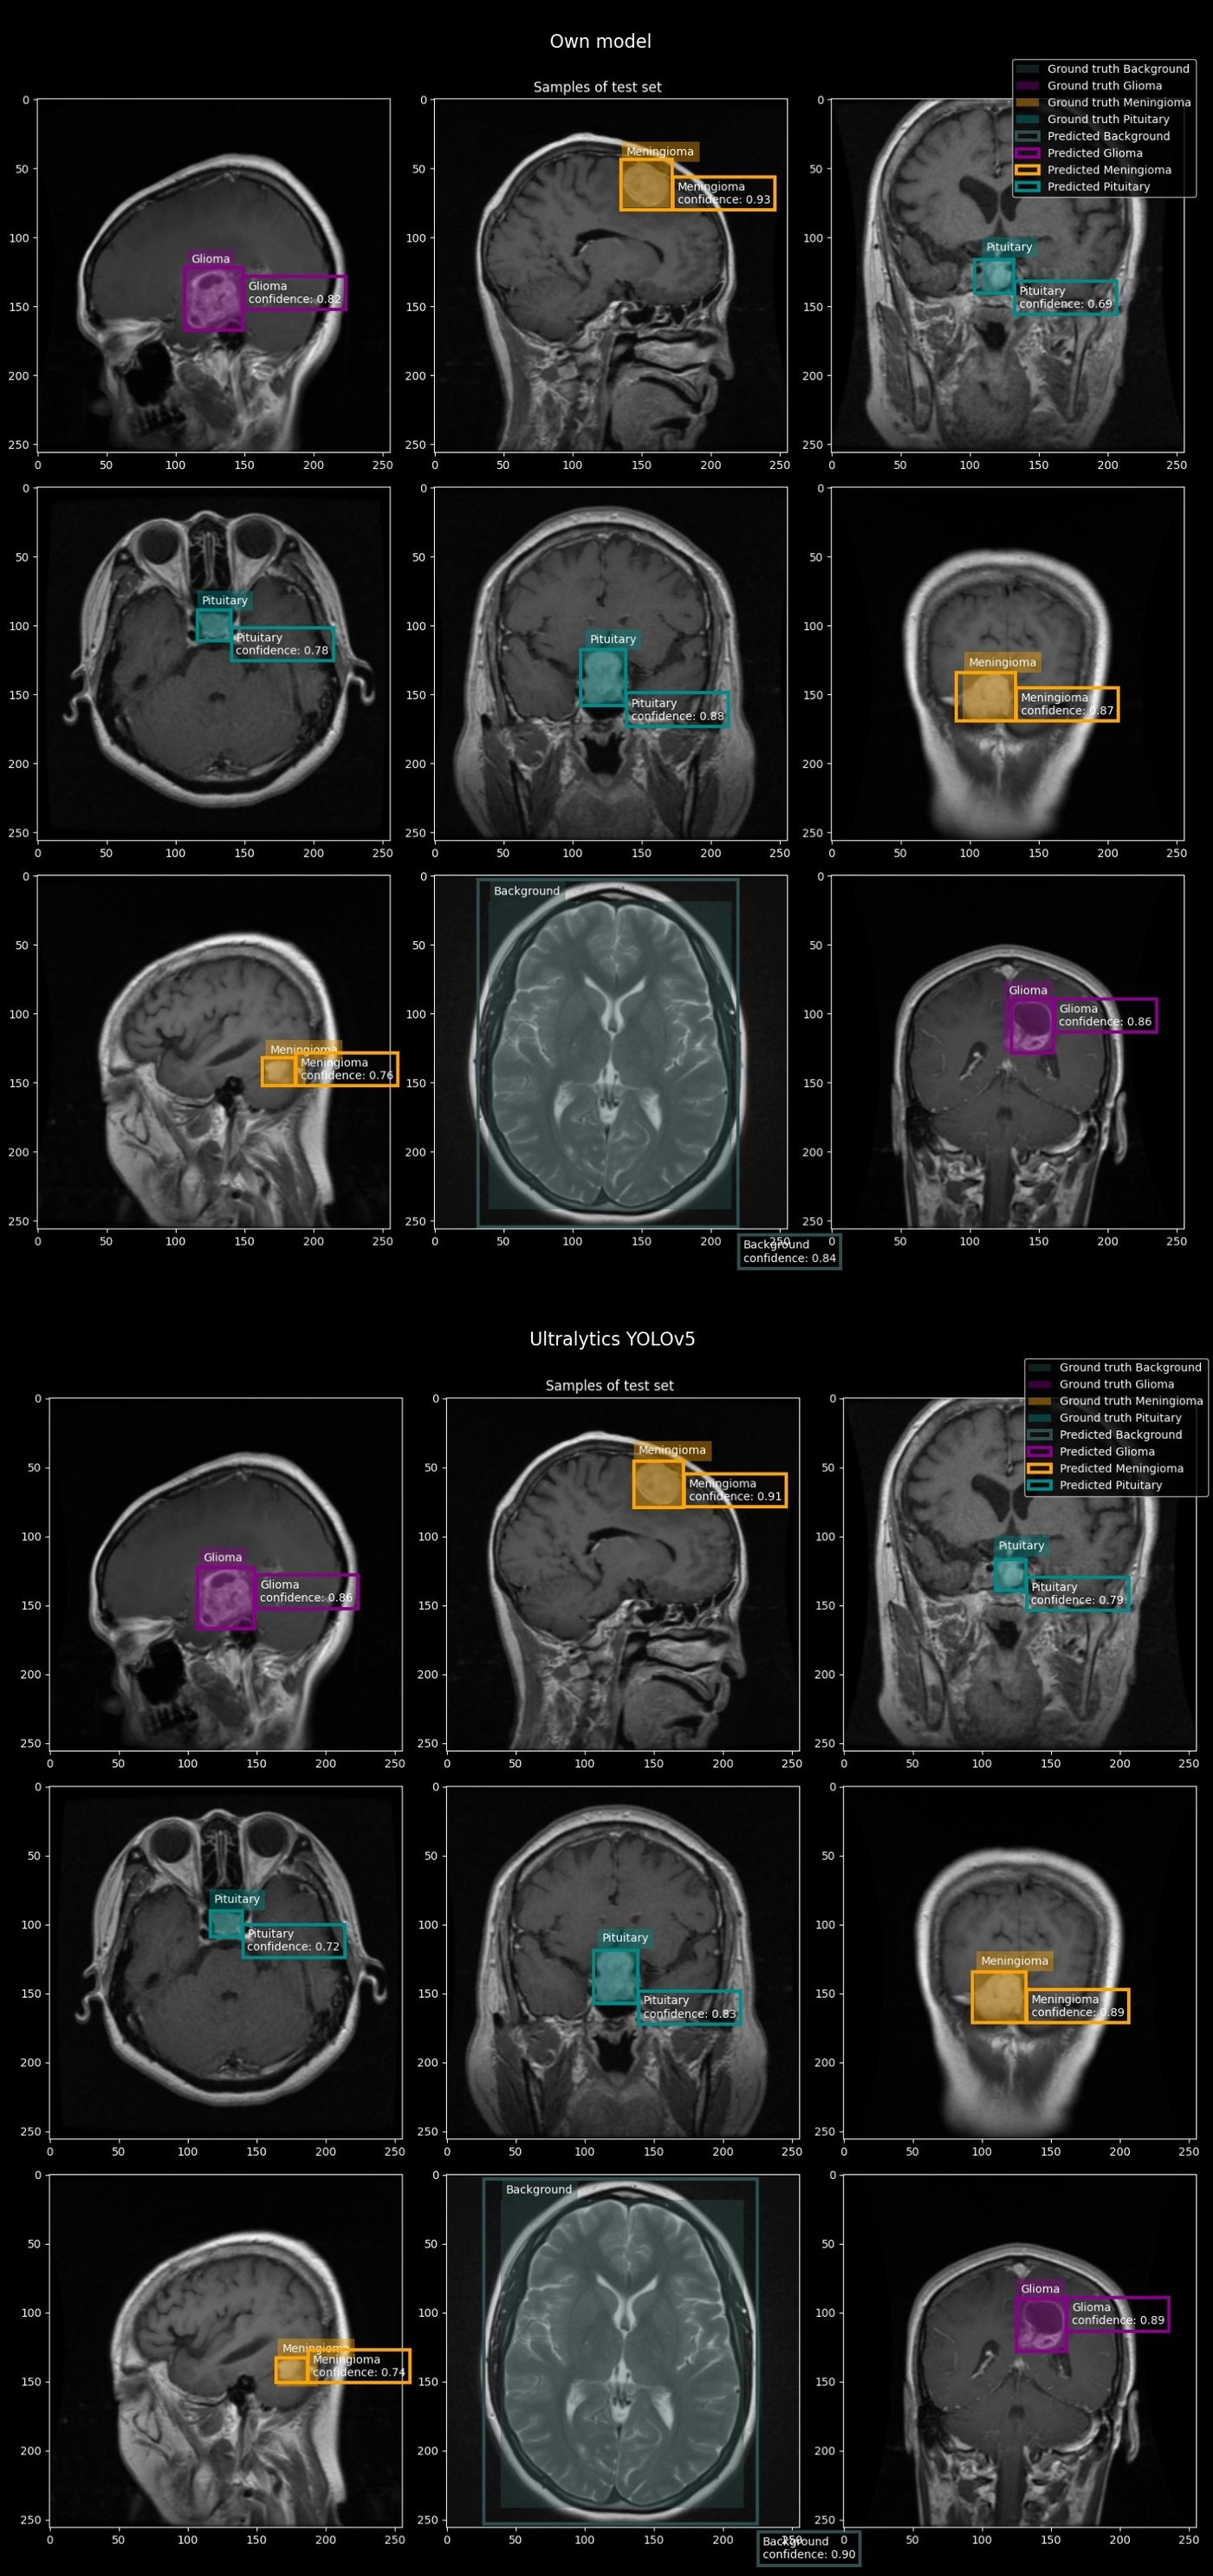
The problem to learn on is brain tumors in MRI slices: find each tumor, draw a box around it, and tell which of three types it is, glioma, meningioma or pituitary tumor. Some images have no tumor at all. Those have a box around the whole brain, which the notebook labels Background. Every labeled box, a tumor or Background, is a target the detector learns to find.
The approach
A detector from its parts
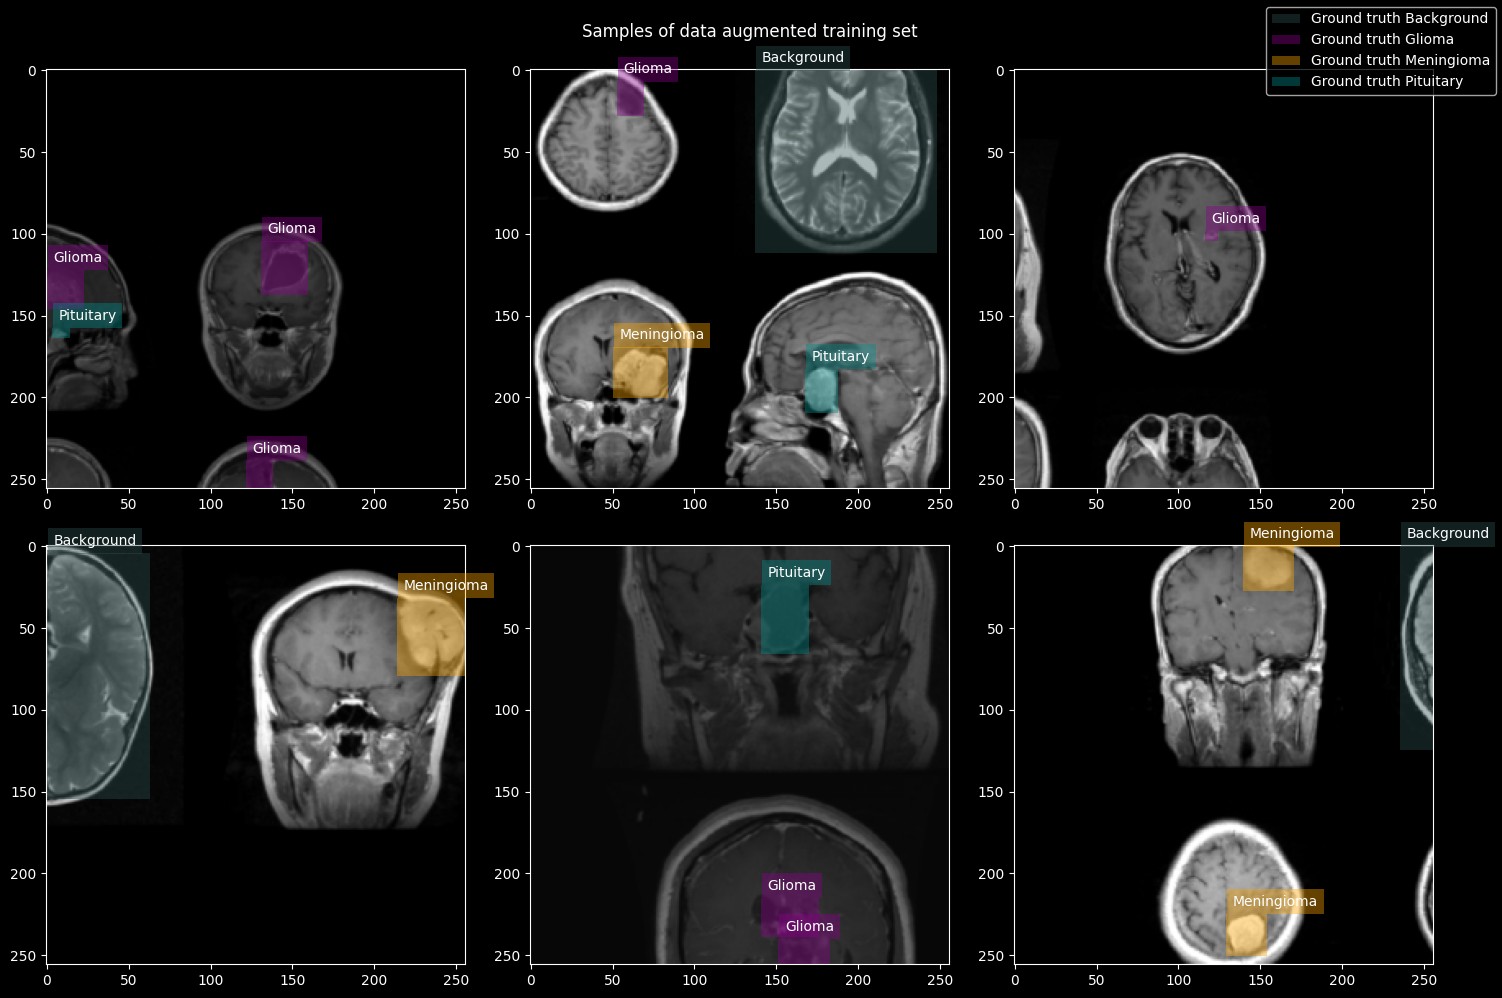
The design follows Ultralytics YOLOv5, but every part is written from its building blocks instead of imported: a backbone that turns the image into features, a neck that combines them across scales, and a head that makes the predictions. The model has 15.8 million parameters and starts from random weights. Images are resized to 256 pixels, and every training image is a mosaic of four, flipped, scaled, shifted and changed in color.
The head looks at the image as three grids, 32, 16 and 8 cells across. In every cell, three anchors, preset box shapes, each predict a box, an objectness score that says whether a target is there, and class scores for the three tumor types and Background. That makes about 4000 predictions for every image. Only the few near a target learn its box and class. All the others learn that nothing is there.
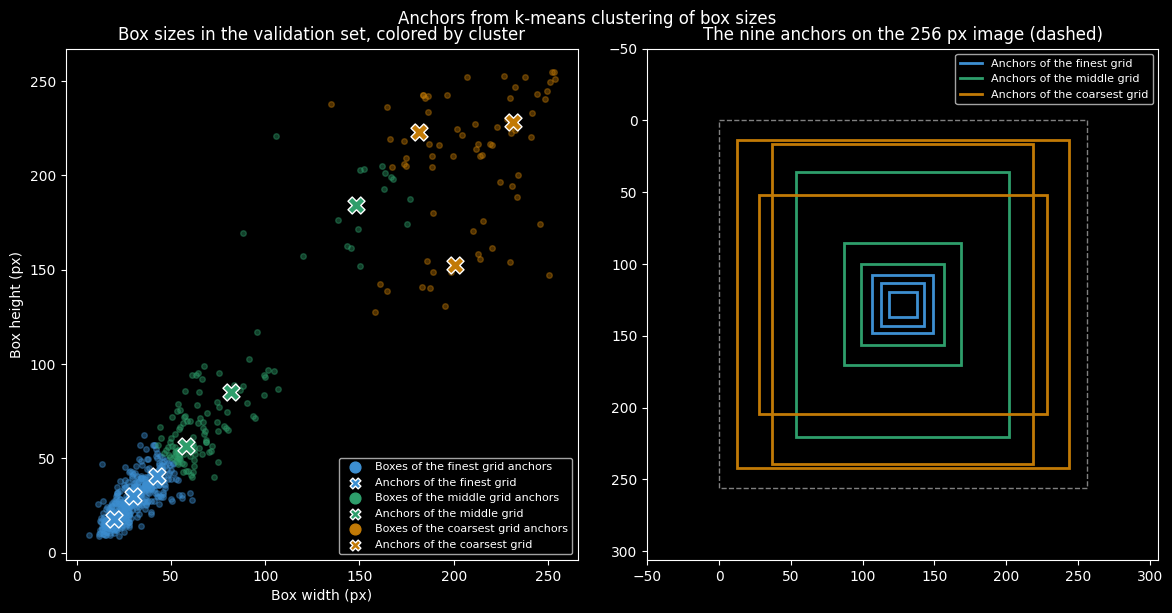
The anchor shapes are found from the data, by clustering the sizes of the labeled boxes. A target only trains the anchors close to its own shape, so the anchors decide what each grid learns to find. Here the clustering spent four of the nine anchors on the large Background boxes, which are 14% of all boxes, and left five for the tumors.
One target, many boxes
During training, each target is handed to several predictions at once: the cell of its center and up to two neighbors, every anchor of similar shape, on every grid. So the trained model answers one target with many boxes that almost overlap. Non-maximum suppression cleans this up. It keeps the box with the highest objectness and removes every other box that overlaps it by more than 0.4, measured as the shared area divided by the combined area.
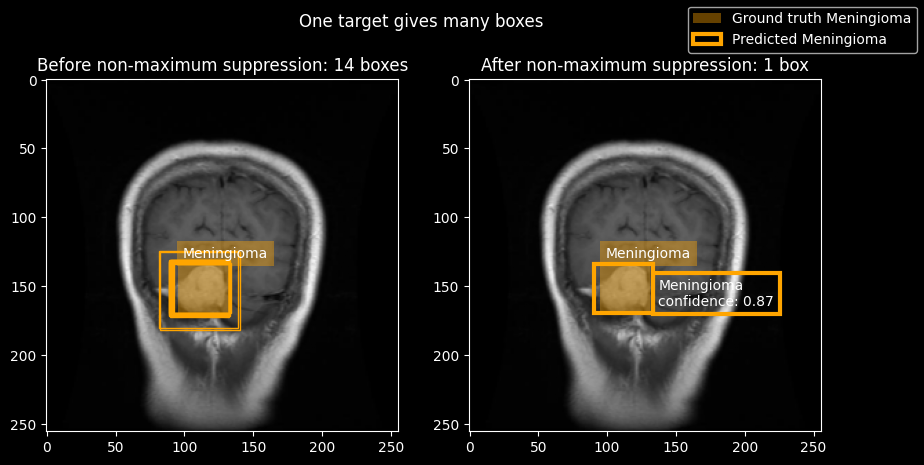
The same rule has a cost. It works across classes, so a second, real target that overlaps the first by more than 0.4 is removed as if it were a duplicate. Ultralytics suppresses within each class only, and only above 0.7.
Scores that were too good
An earlier run scored an F1 score of 0.88 for my model and 0.89 for YOLOv5. The F1 score combines precision, the share of a model’s detections that are correct, with recall, the share of tumors it finds, and it is only high when both are.
The cause was both the data and how I split it. The data set combines source collections that overlap, so about a quarter of its images are identical copies of another image, and neighboring slices of one patient’s scan look almost the same. I had split the images one by one, so copies and neighboring slices landed on both sides: 42% of the test images had an almost identical image in the training set. Even the data set’s own split shares 213 groups of identical files between training and validation.
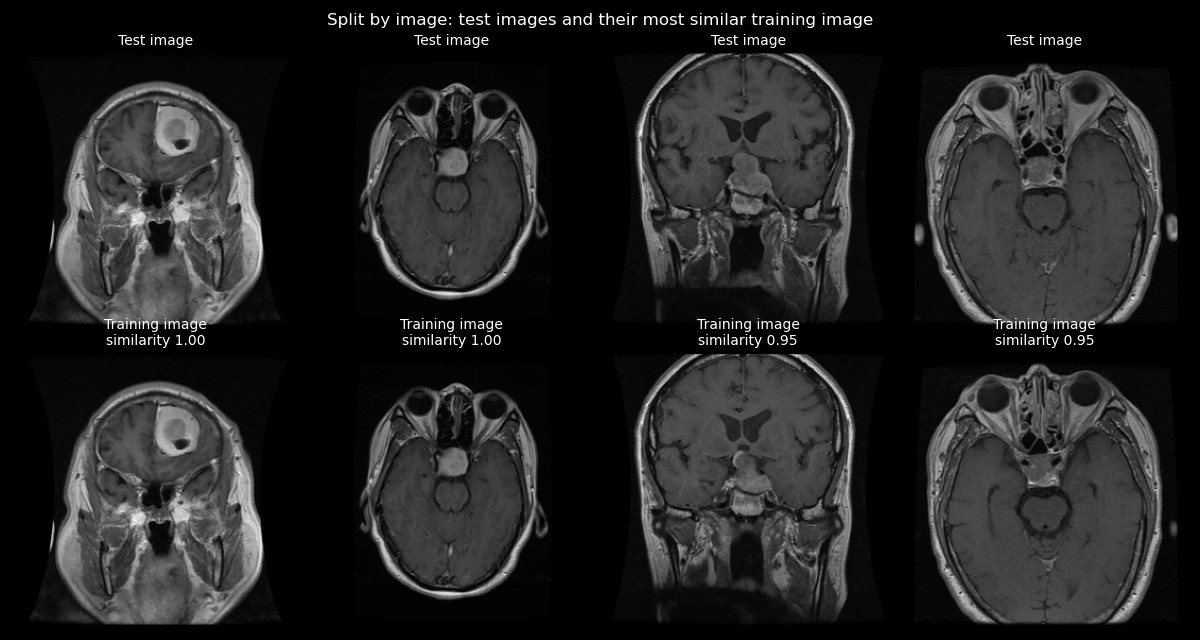
I removed the copies. The data set has no patient ids, so I grouped the images by similarity and split whole groups into training, validation and test sets. The scores dropped to 0.76 for my model and 0.81 for YOLOv5. For YOLOv5 the drop also includes a switch from pretrained to random weights and to a smaller size.
Three bugs were still in the notebook, and the last run fixes them:
- For the 13% of images that are not square, the resize step stretched and shifted every true box, both as a training target and as the ground truth both models are scored against.
- Boxes were never clipped at the right and lower edge, so some reached past the image.
- My model was evaluated in training mode, so its batch normalization scaled each image by the statistics of its batch of 32, not by those learned in training.
With the fixes, both models score 0.83. Evaluation mode alone moved the earlier model’s score by less than 0.01, so most of my model’s gain likely comes from the corrected boxes. YOLOv5 trains from the label files, so for it only the scoring changed.
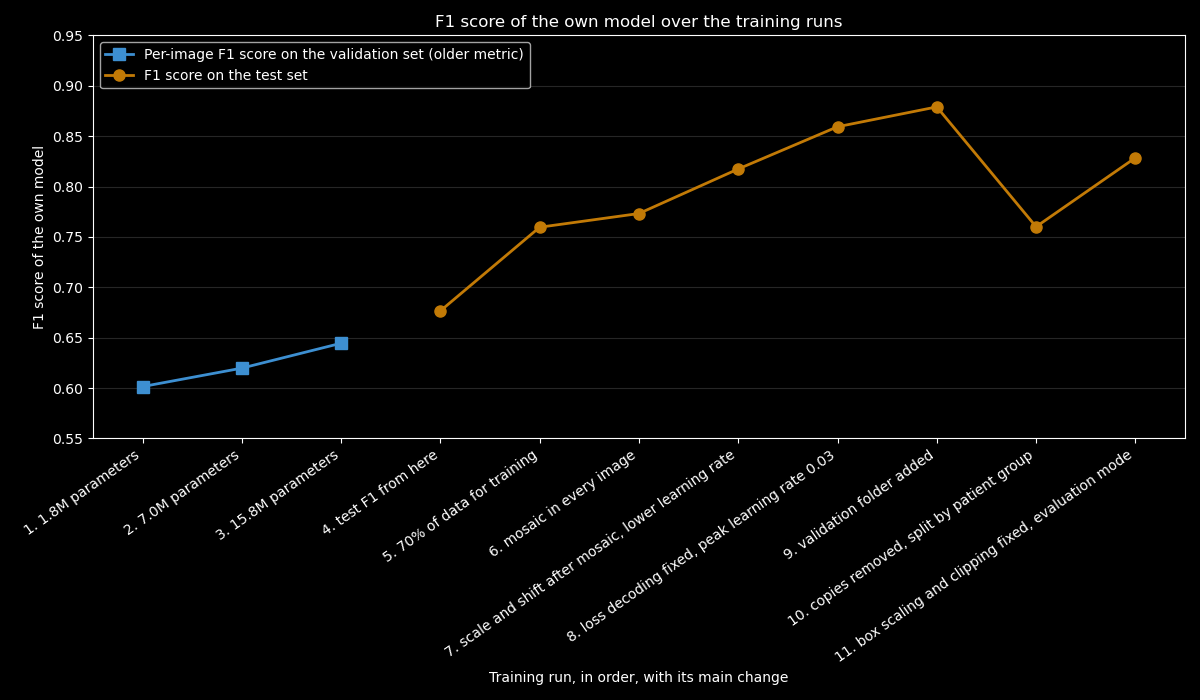
How much of the climb before the last two runs would hold on a clean split is unknown, since all of those runs were scored on the split by image.
Results
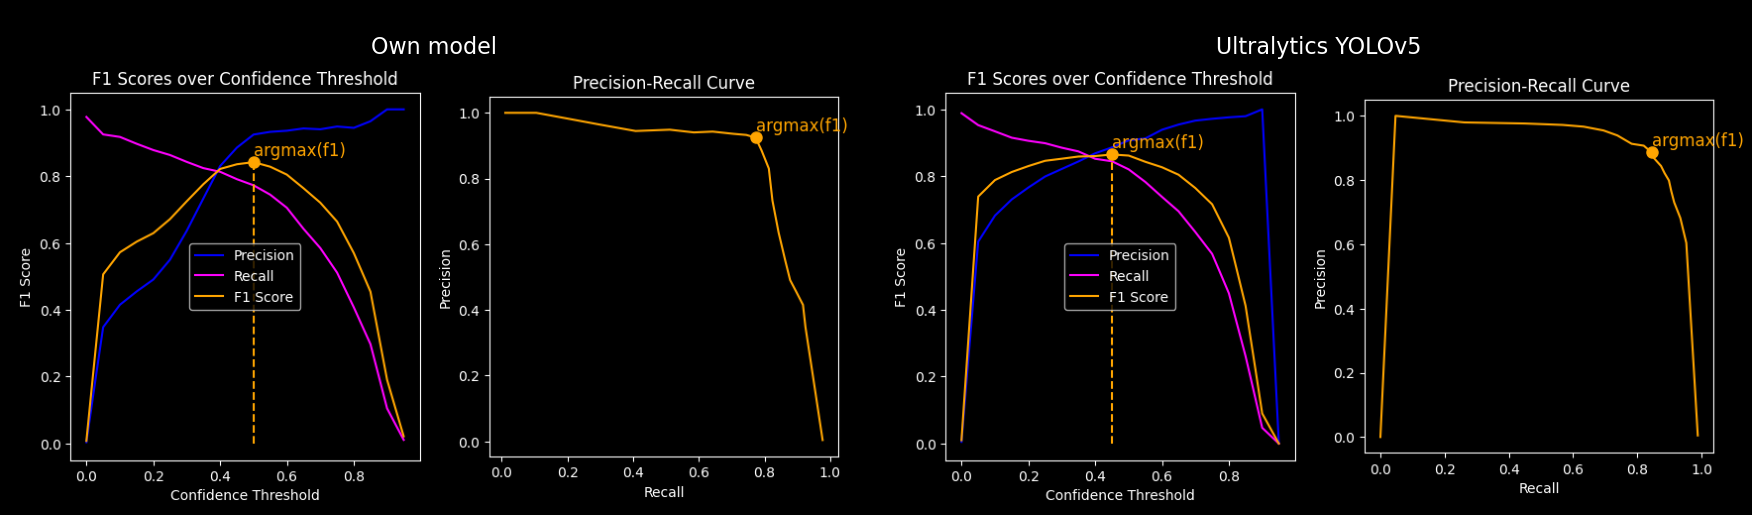
Both models are trained from random weights on the same split and scored with the same code. YOLOv5 is scaled to the depth and width of my model, which makes the backbone and neck identical. What differs is the head, how targets are assigned to predictions, the loss, what counts as confidence, the suppression and the training settings. Each model runs at the confidence threshold that gives its best F1 score on the validation set, 0.50 for mine and 0.45 for YOLOv5, and a detection counts as correct when it overlaps a true box by at least 0.4 and has the right type.
| My model | Ultralytics YOLOv5 | |
|---|---|---|
| Parameters | 15.8 million, 36 thousand in the head | 20.0 million, 4.2 million in the head |
| Precision | 0.91 | 0.87 |
| Recall | 0.76 | 0.80 |
| F1 score | 0.83 | 0.83 |
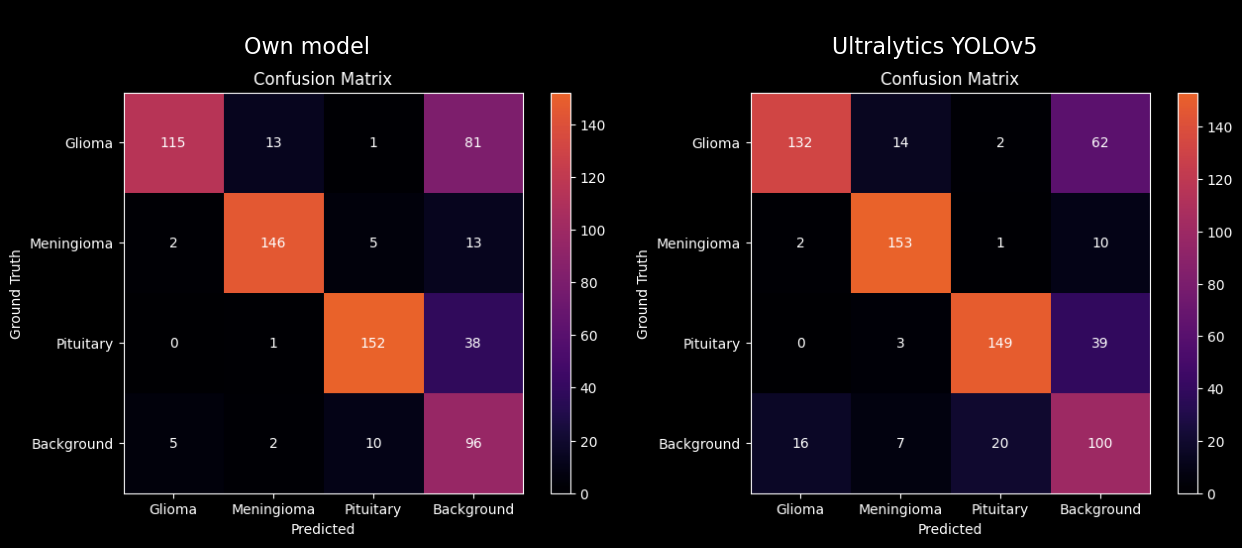
Both models reach the same F1 score. Mine is more precise, and YOLOv5 finds more of the tumors. Both rarely give a tumor the wrong type. Their errors are mostly tumors they miss.
The two also differ in how they rank their own detections. My model’s confidence is its objectness score, trained toward how well the box fits, and its F1 score has a narrower peak over the threshold. YOLOv5 ranks boxes by class score, how sure it is of the class, and stays close to its best over a wide range of thresholds. Whether the kind of score causes this difference is not tested.
Where it fails
Gliomas are the weak spot for both models. My model misses 81 of 210, and YOLOv5 62. For any medical use, a missed tumor is the expensive mistake.
There are known limits:
- Without patient ids, the grouping is a heuristic. Slices of one patient that look less alike can still end up in different sets.
- The comparison with YOLOv5 doesn’t isolate a cause. The head, the assignment, the loss, the confidence, the suppression and the training settings all differ at once.
- Some assigned cells can never place their box exactly. A neighbor cell can lie up to 1.5 cells from the target’s center, but my box encoding reaches only 1. YOLOv5’s reaches 1.5.
- Each model was trained once, on one split, so differences of a few hundredths may not repeat with another seed.
- Images without a tumor are not scored, except that a tumor predicted on one counts as a false detection.
Status
A learning project, not a medical tool. Next, the three losses logged separately to see how they develop against each other, and predictions compared with and without suppression and at other overlap thresholds.
The images come from the Kaggle data set MRI for brain tumor with bounding boxes, public domain (CC0).
Code: github.com/johndah/object-detection. The notebook also runs on Kaggle.